UPDATE: The stable Chrome 73 version has been released on 12
Many web developers use Google Chrome as their main browser – Hands on, I enjoy Firefix as well – but there’s always new eye-catching features in Chrome to pursuade developers to debug on it
Recently, Google Chrome Developers YouTube Channel added a new video to highlights the new features in Chrome 73, presented by Kayce Basques – Senior Technical Writer at Google, he primarily writes all of the docs for Chrome DevTools, I highly encourage you to watch that video, but for now – I am going to highlights my Top 3 DevTools Features in Chrome 73:
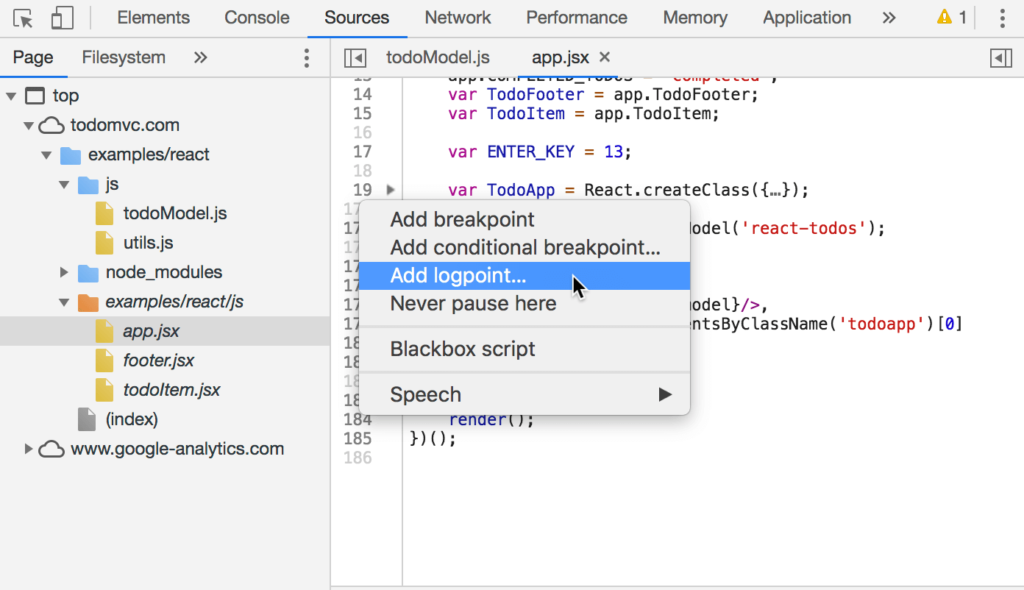
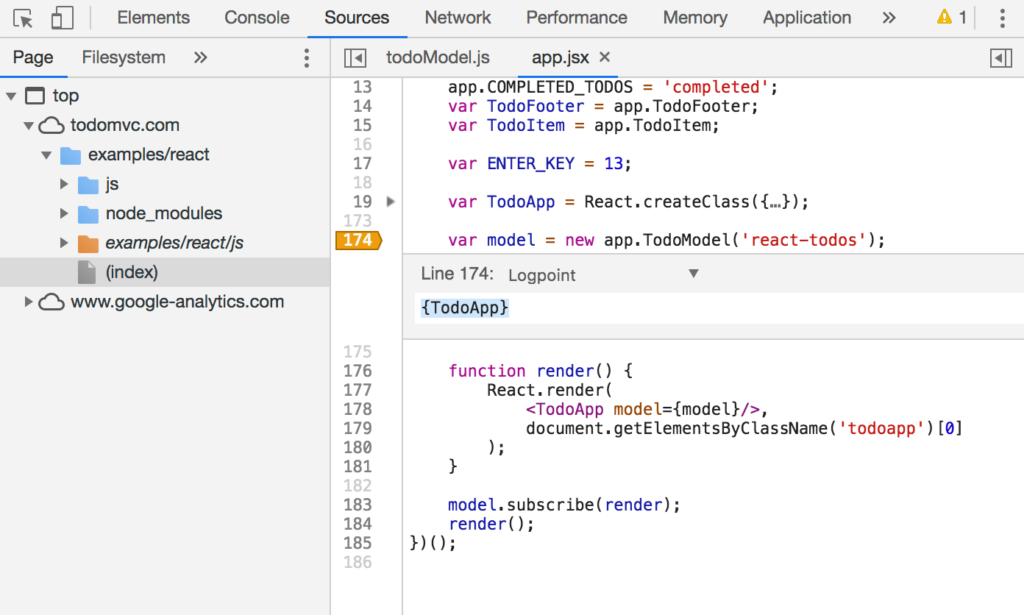
1) Logpoints
Oh, finally – We don’t need to fill up our code with console.log anymore!


That’s it. The “
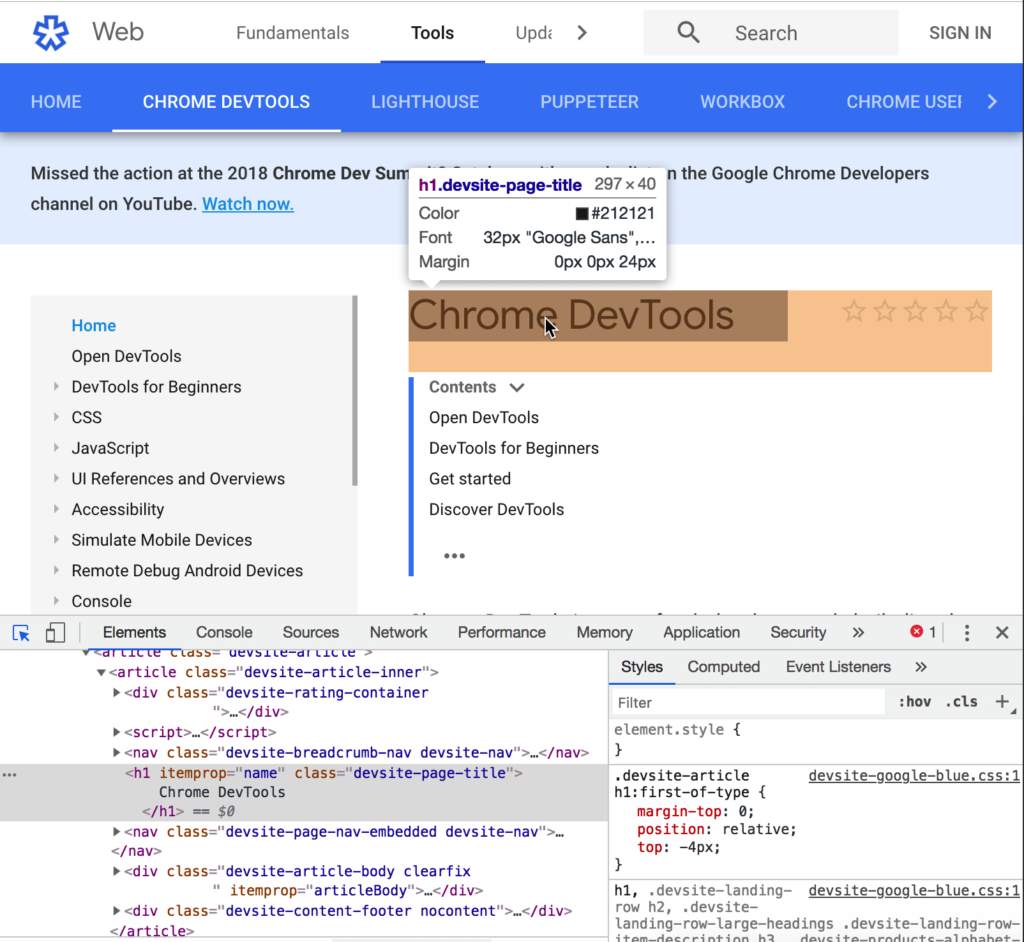
2) Detailed tooltips in Inspect Mode
When you have a node with CSS Specificity problems, it’s hard to know what’s the actual values, and the normal way is to scroll down through the “Styles” section from the “
Well, thanks to Chrome 73 – We can see more information while inspecting an element, not only the node’s name and size as we get used to. Let’s take a look on the new inspecting mode:

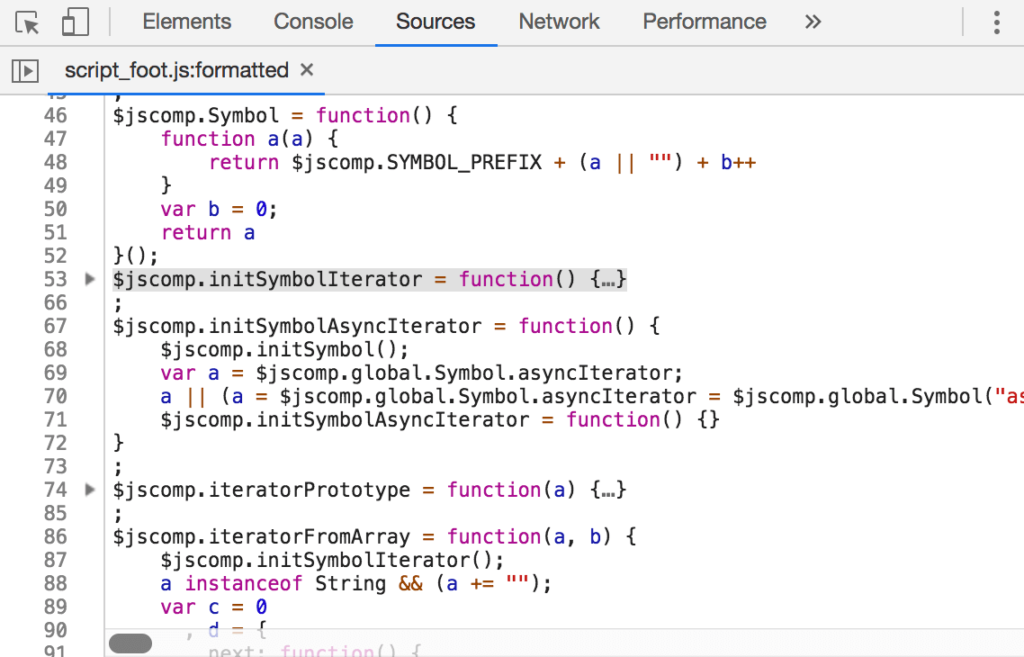
Code folding
All editors allow us to “Fold” or “Unfold” some blocks of code, while the browser don’t. We’ve to keep scrolling huge files without that little small arrow at the left side of a code block (i.e. Conditional Statement, Loop, Function, … etc.)
Finally, this feature is shipped to Chrome 73:

There are more Chrome 73 Devtools cool features, like; AAA contrast ratio line in the Color Picker, Export code coverage data, Navigate the Console with the keyboard, and more. But those mentioned 3 above will be the most used IMHO – At least for me! 😅
*As Chrome 73 isn’t released yet, I used the images from Kayce’ Article on Google Developers Website